
GW150914 · 14 September 2015
A ripple reaches Earth.
Two instruments. Half a second of measured strain. One event that changed what people could observe.
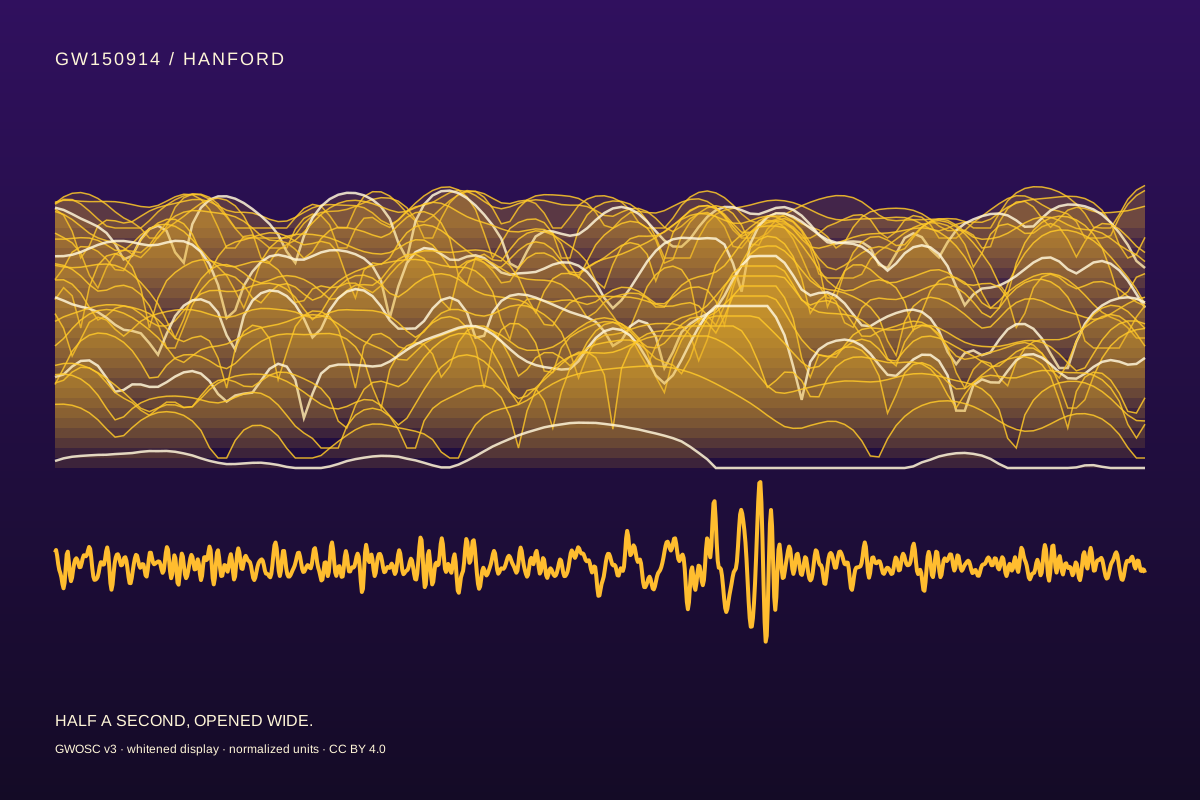
Hanford and Livingston each recorded calibrated strain around the event.
THE MEASUREMENT
A fraction, measured twice.
The source quantity is calibrated, dimensionless gravitational-wave strain h(t). In Filtered strain mode, values use strain ÷ 10⁻²¹ as a shared display unit. They are not displacement, audio, or a reconstructed waveform.
Bright applies a fourth-order 35–350 Hz Butterworth band-pass with zero-phase filtering to the full 32-second files before cropping this half-second view. The default whitened view first balances the noise spectrum using GWOSC’s archived tutorial recipe; its values are normalized display units, no longer strain. Switch to Filtered strain to see the difference. The ridges map jointly normalized log PSD from 16–400 Hz. Height and time are exaggerated for legibility.
GWOSC whitening tutorial ↗. Bright uses a 35–350 Hz final band instead of the tutorial’s 20–300 Hz. A 32-second noise estimate is a display aid, not a detection, reconstruction, SNR or significance analysis.
4,096 Hzsource sample rate
2,048samples in this focus
32 ssource file duration
What the files carry
Instrumental lines and glitches can appear in detector strain. All seven released data-quality bits are set in this interval. H1’s five injection flags are clear; L1’s continuous-wave hardware-injection flag is active. These display derivatives do not independently validate an astrophysical interpretation.
GWOSC technical details ↗RELATED RESEARCH · A DIFFERENT DATE
A quieter instrument.
A later chapter.
A 2025 paper reports reinforcement-learning mirror control tested in 2024. It did not enable the 2015 observation shown above.
Read the later control research →